OFSTED, SIAMS and Statutory Results
Ofsted Reports and Statutory Assessments
On this page you can access lots of key documentation and data about our school. In addition to this data, there is lots more about our school and our values on the 'About Us' menu.
Our most recent Ofsted inspection was in March 2026
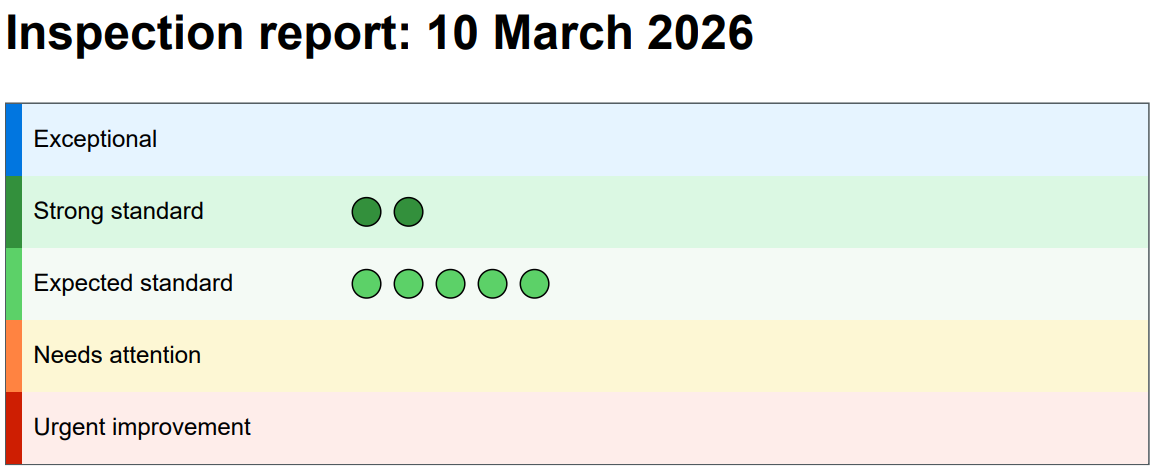
The Ofsted framework changed at the end of 2025. Single judgements were removed and replaced with a much more detailed report card. There is also a new grading system:
- Exceptional – among the very best nationally, practice to share.
- Strong Standard – excellent, consistent work making a real difference.
- Expected Standard – everything the school should be doing to meet high expectations.
- Needs Attention – areas where work is underway but impact isn’t yet visible.
- Urgent Improvement – significant changes needed.
We are absolutely delighted to share that Ofsted evaluated us as Strong Standard in both 'Inclusion' and 'Personal development and wellbeing' and Expected Standard in all other areas.
The safeguarding standards were met. This means that leaders and those responsible for governance and oversight fulfil their specific responsibilities and have established an open culture in which safeguarding is everyone's responsibility and concerns are actively identified, acted upon and managed. As a result, pupils are made safer and feel safe.
Pupils feel safe and well cared for. They trust staff to deal with issues quickly, such as bullying. Pupils form positive relationships with their peers and staff. In the classroom, pupils ask and answer questions enthusiastically. They sustain effort, listen carefully and respond to feedback. In the playground, pupils of all ages play together harmoniously. Oftsed 2026
The inspection team identified a strong inclusive culture where “pupils love coming to this welcoming and inclusive village school” and staff “know pupils’ strengths and quickly identify any barriers to learning”. The report highlights the school’s commitment to personal development of the children which means that “they are extremely well prepared for life in modern Britain.”
It was noted that the “school’s values of ‘love, respect and hope’ come through in the way pupils treat each other” and that the pupils feel safe and well cared for. They also “enjoy learning through a well-organised and ambitious curriculum that builds their knowledge and skills over time and exhibit high levels of resilience and self-control.”
Inspectors also praised the extra-curricular offer of clubs and activities which ensure that “all pupils benefit from the rich and varied array of opportunities”.
Pupils love coming to this welcoming and inclusive village school. The school day starts with friendly greetings and calm routines. The school’s values of ‘love, respect and hope’ come through in the way pupils treat each other. Oftsed 2026
Character development takes inspiration from figures such as Anne Frank. Pupils learn, 'How wonderful it is that nobody need wait a single moment before starting to improve the world.' Pupils understand they can make a difference. They actively take on coveted leadership roles, such as collective worship ambassadors, house captains or librarians. Oftsed 2026
Latest Ofsted and School Inspection Reports
If you have any questions about any of the information shown on these pages, please do not hesitate to contact the school and arrange a meeting with one of the team.
Please find below our most recent Church Inspection Report (SIAMS) and relevant information from the Department for Education Performance Tables.
Latest Ofsted and School Inspection Reports
Churchill Church of England SIAMS Report 2018
School Performance Data
Below are tables showing our latest performance data. There is also a link to the DFE website where further performance information can be found.
Outcomes in 2025
EYFS (Reception), Phonics (Year 1) and Multiplication Screening Check (MTC) (Year 4)
|
Assessment |
School |
National |
|
Early Years Foundation Stage |
School 2025 |
National 2025 |
|
Good Level of Development |
69% |
69% |
|
Year 1 |
School 2025 |
National 2025 |
|
Phonics Screening Check |
89% |
80% |
|
Year 4 |
School 2025 |
National 2025 |
| % of pupils scoring full marks (25/25) | 43% | 38% |
|
Multiplication Screening Check (MTC) - average score out of 25 |
22.3 |
21.1 |
KS2 Results
It is important to note, that as an inclusive school we have some children with complex additional needs and have Education Health Care Plans (EHCPs) to support their learning. In some cases, these needs mean that the pupils are working below the level of the test and are unable to access the SATs. In 2024, this represented 12% of the cohort.
In 2025, all of the cohort completed the assessments, this included pupils who have recently joined the school from abroad and from non-English-speaking countries.
|
Assessment |
School 2025 |
National 2025 |
|
Reading, Writing and Maths combined - % of pupils achieving the expected standard |
75% | 62% |
|
Reading - % of pupils achieving the expected standard |
89% | 75% |
|
Reading - % of pupils achieving the higher standard |
38% | 33% |
|
Writing - % of pupils achieving the expected standard |
93% |
72% |
|
Writing - % of pupils achieving the higher standard |
3% | 12% |
|
Mathematics - % of pupils achieving the expected standard |
86% | 74% |
|
Mathematics - % of pupils achieving the higher standard |
34% | 26% |
|
English Grammar, Punctuation and Spelling - % of pupils achieving the expected standard |
93% | 72% |
| English Grammar, Punctuation and Spelling - % of pupils achieving the higher standard | 45% | 29% |
|
Science - % of pupils achieving the expected standard |
93% | 82% |
Average Scaled Scores - KS2 Assessments 2025
|
Assessment |
School 2025 |
National 2025 |
|
Reading |
108 | 106 |
|
Maths |
107 | 105 |
|
GPS |
109 | 105 |
2024 Data
EYFS (Reception), Phonics (Year 1) and Multiplication Screening Check (MTC) (Year 4)
|
Assessment |
School |
National |
|
Early Years Foundation Stage |
School 2024 |
National 2024 |
|
Good Level of Development |
76% |
68% |
|
Year 1 |
School 2024 |
National 2024 |
|
Phonics Screening Check |
81% |
80% |
|
Year 4 |
School 2024 |
National 2024 |
|
Multiplication Screening Check (MTC) - average score out of 25 |
19.9 |
20.6 |
![]()
Compared to National Data
![]()
Data including all pupils, including those who did not sit the test.
![]()
Outcomes in 2023
EYFS (Reception), Phonics (Year 1) and Multiplication Screening Check (MTC) (Year 4)
|
Assessment |
School |
National |
|
Early Years Foundation Stage |
School 2023 |
National 2023 |
|
Good Level of Development |
72% |
67% |
|
Year 1 |
School 2023 |
National 2023 |
|
Phonics Screening Check |
75% |
79% |
|
Year 4 |
School 2023 |
National 2023 |
|
Multiplication Screening Check (MTC) - average score out of 25 |
20.1 |
20.2 |
KS2
It is important to note, that as an inclusive school we have some children with complex additional needs and have Education Health Care Plans (EHCPs) to support their learning. In some cases, these needs mean that the pupils are working below the level of the test and are unable to access the SATs. In this cohort, they represented 9.6% of the cohort. The first table shows our figures excluding these pupils. National figures including all pupils, are shown below.
![]()
Compared to National Data for 2023
![]()
Data including all pupils, including those who did not sit the test.
![]()